
http://www.northlan.gov.uk/business+and+employment/local+economy/economic+information/lorenz+curve.jpg
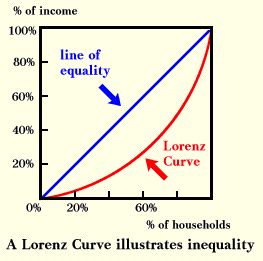
The Lorenz curve depicts the presence of income inequality in a population by charting the income levels of the population cumulatively. The further bowed and distorted from the 45 degree center diagonal, the greater the inequality. In this chart, the degree of inequality increased from 200/2001 to 2005/2006.
The Lorenz curve depicts the presence of income inequality in a population by charting the income levels of the population cumulatively. The further bowed and distorted from the 45 degree center diagonal, the greater the inequality. In this chart, the degree of inequality increased from 200/2001 to 2005/2006.
No comments:
Post a Comment