Classed or Unclassed
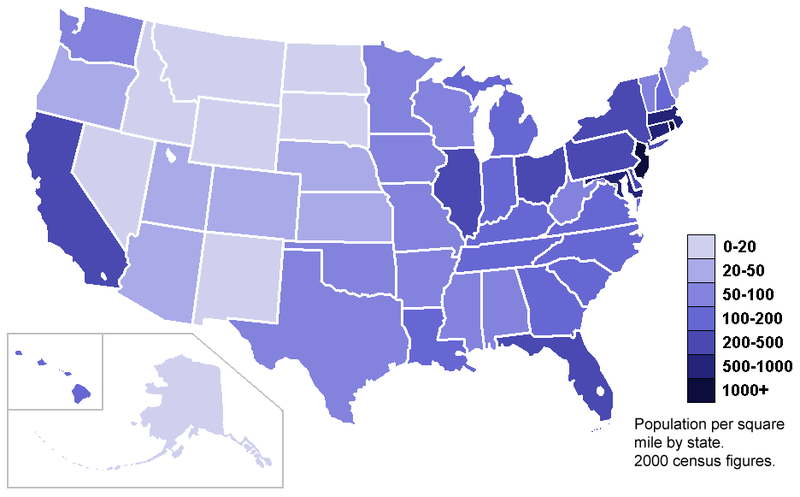
A classed choropleth will take the area units and divide them into groupings based on a chosen range. For example:
Above is an unclassed choropleth of the United States, and below the states are divided into 7 groupings based the population density in a classed choropleth.
The decision about number of classes and ranges must be made with the information and detail desired in mind, as well as how visually distinctive it will be able to be. A common number of ranges is four to seven. To arrive at the appropriate size of each range mathematical processes of equal steps, quantiles, natural breaks or minimum variance can be used.
Bivariate and Univariate
Univariate choropeths illustrate one variable and bivariate choropleths illustrate two.
The univariate below shows a range from blue (100% Democrat) to red (100% Republican) for US counties.
The bivariate choropleth below depicts the number of human West Nile Virus cases as well as the disatnce from the Mississippi in which they occured.
.jpg)
.jpg)
Standardized and Unstandardized
Standardized choropleths have taken the data and averaged or standardized them in some manner for the areas. An example would be population per square mile to show density rather than only a numeric value. Another example would be to show data as a percent.
This map is standardized showing population density in the states.
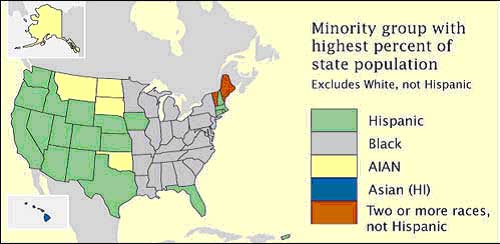
Nominal
A choropleth depicting nominal data shows a specific variable that is not in an order or rank. This example provides the answer to "which minority makes up the larget percent of the total state population" but there is no value, or order provided.


No comments:
Post a Comment