http://www.lib.utexas.edu/maps/europe/west_germany_ind_1972.jpg
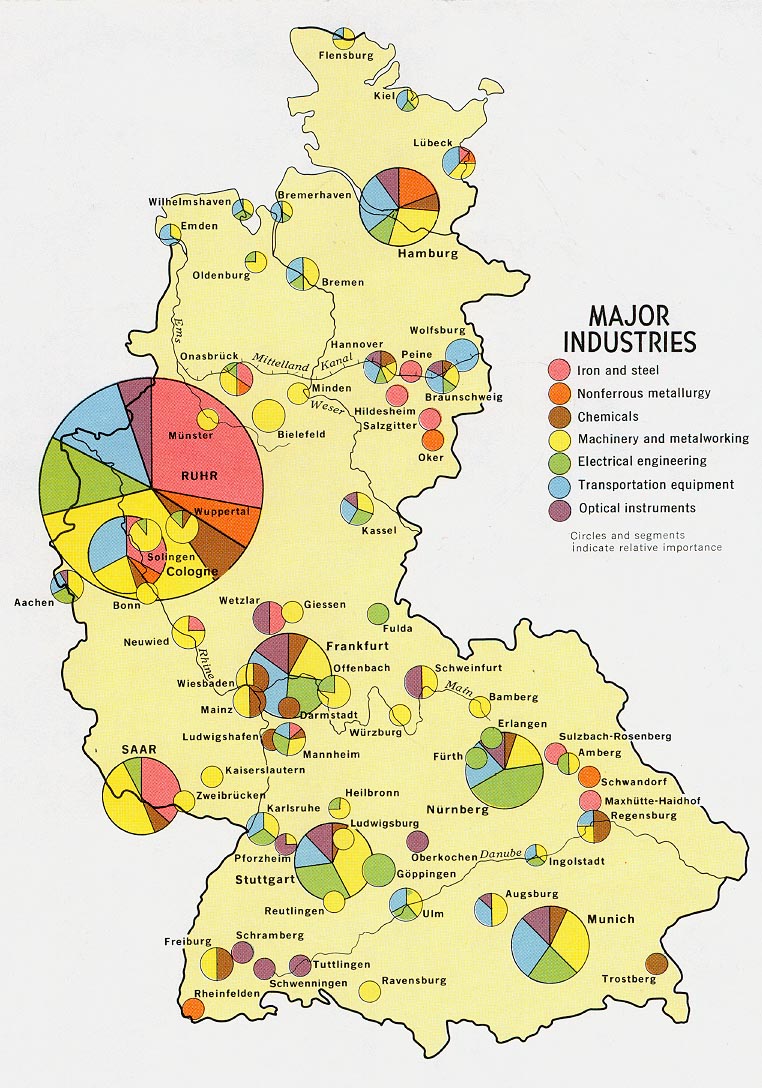
Continuously Variable Proportional Circle Map
This map (above) of West German industries uses color for industry type and circle portion/size for relative amount of the industry in the region.Continuously Variable Proportional Circle Map

http://mapmaker.rutgers.edu/355/dotProporCircle.jpg
Range Graded Proportional Circle Map
Range Graded Proportional Circle Map
This is a map that has clearly defined range graded proportional circle aspects to it, as well as the use of a dot format for the rural areas.
Maps known as "point pattern maps" can be used as a tool to illustrate patterns of occurrences in and between locations. Examples would include population, libraries, crime, income level, and voting patterns. Dot density maps and porportional circle maps are two types of point pattern maps.
Dot density maps are nonproportional (the dots will be of equal size and represent a fixed number of items) and can be nominally differentiated. In contrast, porportional circle maps use different sizes to illustrate the proportions of the variable being viewed.
Proportional circle maps will either be continuously variable (there will be many sizes that portray the range of the data) or range graded (a specific number of circle sizes will be chosen and a range assigned to each).
No comments:
Post a Comment